Indoor temperature and humidity mapping
Unisyst Engineering Ltd. provides temperature and humidity mapping through direct recording of environmental parameters with calibrated sensors. Sensor locations are determined after preliminary inspection and thermographic camera imaging. There is no limit to the recording duration, which depends only on the production cycle and the requirements of the quality system.
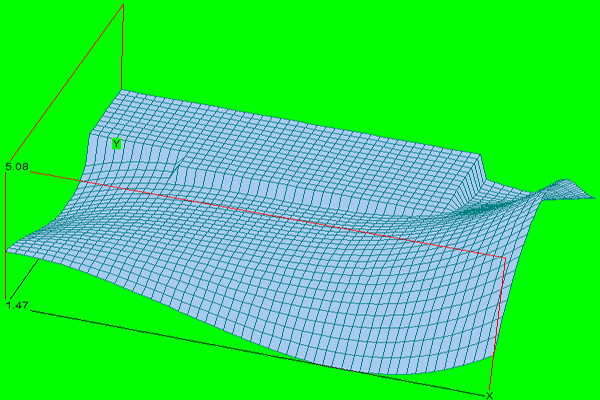
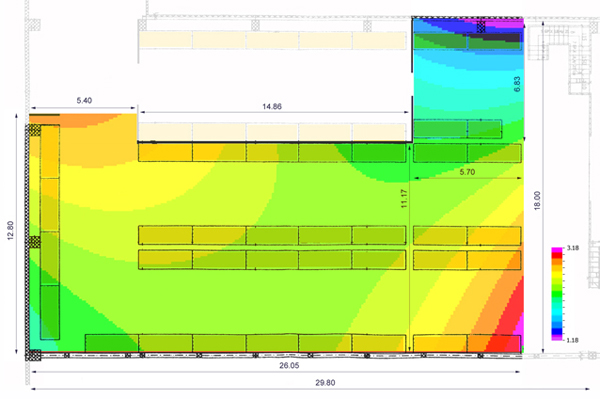
After measurement, temperature and humidity values are recorded at 1-minute intervals. The results from all points are processed with specialized software to obtain the distribution of temperature and humidity in different planes of the warehouse. The accuracy of the method is 0.1 °C and 0.1 %rH with resolution below 0.50 m.
The resulting data provide information about the places with the greatest fluctuations, identify the sources of these fluctuations and show heat flows in the warehouse.
Where it is applied
Mapping the distribution of temperature and humidity is needed wherever substances particularly sensitive to environmental parameters are stored or produced.
In particular, pharmaceutical storage requirements for environmental parameters are determined by the "Guide to Good Distribution Practice for trade in medicinal products for human use" of March 7, 2013.
When applied
Temperature and humidity mapping is performed when the warehouse is put into service and in all other cases when:
- significant architectural changes have been made in the warehouse;
- architectural changes outside the warehouse have a direct impact on temperature and humidity in the facility;
- significant changes have been made to the equipment maintaining temperature and humidity;
- significant changes have been made to the equipment recording temperature and humidity.
Temperature and humidity distribution mapping should be repeated depending on the results of the risk assessment. Mapping is recommended periodically during the coldest and warmest months of the year.
The mapping results are used by all departments concerned with the quality of the stored products. Mapping data for such units are part of the mandatory risk assessment required by the quality system.
In all cases, this information leads to more precise determination of temperature and humidity control points, which should be located in the areas with the greatest measured fluctuations. Temperature and humidity mapping helps optimize heat sources and reduce the cost of maintaining internal environmental parameters.
Examples of temperature and moisture mapping of areas: